CHAPTER III To work with Powersim Study: introduction to I use it of the software through a practical example.
3.17 Infuence of the question attended on the production and the wished inventory
What it remains to make for this model is to show like “Expected Demand” influences “Production” and “Desired Inventory”.
That comes made through two links that they go from “Expected Demand” to “Production” and “Desired Inventory”.
The production serves in order to cover the wished inventory and would have to always reflect the waited for question.
One joins, therefore, simply “Expected Demand” to the equation of the production.
- To open the window of definition of “Production”;
- To redefine the equation in this way:
'Expected Demand'+ (“Desired Inventory” - “Inventory”)/'Time to Correct Inventory
It is known also, from the information given, than the inventory that the society wants to maintain it would have to cover four weeks
of waited for question. In order to reformulate the equation for “Desired Inventory” there is need of one constant that represents
a multiple of “Expected Demand”.
Nomination this constant “Inventory Coverage” that goes connected to the variable “Desired Inventory”.
Desired Inventory goes therefore redefined with the equation:
“Expected Demand” * “Inventory Coverage”
Figure 3.15 extension the ended model:
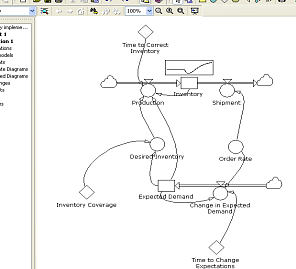
Figure 3.15- Ended model. Expected Demand' is connected to “Production” and “Desired Inventory”, and is held on account when the level of production is decided.
3.18 To compare asks and production in a time diagram
In order to render the simulation of the more effective model to the fine ones it is prati to us that visual Powersim concurs to create diagrams
useful in order to introduce turns out to you.
- Cliccare Time series control on the bar of the instruments and to posizionare the diagram on an empty space of the job sheet; a diagram of empty time will appear;
- In order to insert the variable ones in the diagram to cliccare on the icona Variable tree. On the left of the diagram the variable ones will appear all.
- To drag the variable “Expected Demand” in the diagram in which instantaneously it will appear;
- In the same way to drag in the diagram “Production” and “Order Installments”.
Executing the simulation the result of figure 3 will be obtained.16:
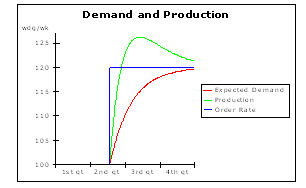
Figure 3.16- The behavior of “Expected Demand”, “Order Installments”, and “Production” in the simulation. The increment of the orders induces to a delayed increase of production and the waited for question
As it is looked at “Order Installments” increases without warning after 20 weeks. Expected Demand slowly follows this change
and after a cero number of weeks it door to the new level of order.
The production, instead, increases, quickly like the orders.
In order to understand well because the production is behaved in this way it must examine also the variable behavior of the two
“Inventory” and “Desired Inventory”.