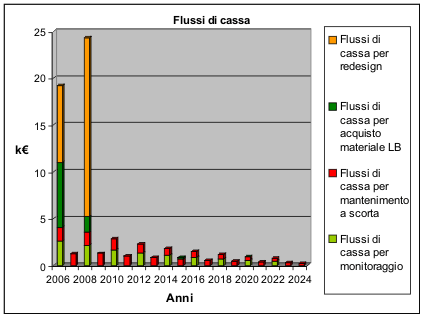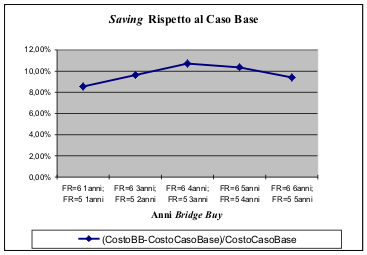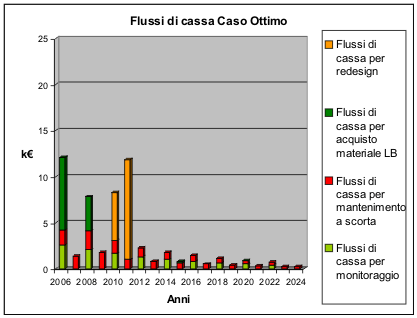
Figure 7.4: Relative cash flows you to the case base of the model.
Chapter 7 - a model developed in a company of the production field and maintenance radar.
7.1.4 It turns out you of the shape base of the model.
It turns out obtained to you from the model, in the described shape over, are brought back in the following table.
|
LRU with members characterizes to you from FR=6. |
||||||||||||||
|
Nome LRU |
Critical types |
Population Critics |
Requirementses 19 |
Action |
CostoLB/CostoRD |
|||||||||
|
LRU 50 |
4 |
95 |
1 |
LB |
2,20% |
|||||||||
|
LRU 24 |
3 |
4 |
1 |
LB |
1,52% |
|||||||||
|
LRU 19 |
7 |
13 |
1 |
LB |
9,33% |
|||||||||
|
LRU 25 |
2 |
3 |
1 |
LB |
0,66% |
|||||||||
|
LRU 26 |
4 |
8 |
1 |
LB |
12,14% |
|||||||||
|
LRU 49 |
9 |
54 |
1 |
LB |
32,95% |
|||||||||
|
LRU 29 |
2 |
4 |
1 |
LB |
1,31% |
|||||||||
|
LRU 20 |
3 |
10 |
5 |
LB |
1,74% |
|||||||||
|
LRU 41 |
3 |
6 |
1 |
LB |
1,55% |
|||||||||
|
LRU 52 |
3 |
8 |
1 |
LB |
2,63% |
|||||||||
|
LRU 33 |
9 |
30 |
1 |
LB |
2,19% |
|||||||||
|
LRU 51 |
4 |
8 |
1 |
LB |
2,23% |
|||||||||
|
LRU 18 |
4 |
37 |
1 |
LB |
39,18% |
|||||||||
|
LRU 45 |
2 |
11 |
1 |
LB |
1,12% |
|||||||||
|
LRU 3 |
2 |
3 |
41 |
LB |
0,81% |
|||||||||
|
LRU 8 |
1 |
4 |
1 |
LB |
0,05% |
|||||||||
|
LRU 40 |
3 |
4 |
1 |
LB |
0,48% |
|||||||||
|
LRU 7 |
2 |
3 |
5 |
LB |
9,57% |
|||||||||
|
LRU 23 |
3 |
18 |
1 |
LB |
21,75% |
|||||||||
|
LRU 5 |
3 |
6 |
3 |
LB |
11,82% |
|||||||||
|
LRU 35 |
1 |
1 |
1 |
LB |
0,01% |
|||||||||
|
LRU 30 |
2 |
5 |
1 |
LB |
1,25% |
|||||||||
|
LRU 53 |
2 |
3 |
1 |
LB |
2,98% |
|||||||||
|
LRU 37 |
6 |
44 |
17 |
RD |
107,65% |
|||||||||
|
LRU 38 |
6 |
29 |
30 |
LB |
82,91% |
|||||||||
|
LRU 36 |
6 |
28 |
1 |
LB |
90,41% |
|||||||||
|
LRU 31 |
6 |
31 |
1 |
LB |
2,79% |
|||||||||
|
LRU 32 |
6 |
28 |
1 |
LB |
1,10% |
|||||||||
|
LRU with members characterizes to you from FR=5. |
||||||||||||||
|
Nome LRU |
Critical types |
Population Critics |
Requirementses 17 |
Action |
CostoLB/CostoRD |
|||||||||
|
LRU 2 |
1 |
4 |
3 |
LB |
0,01% |
|||||||||
|
LRU 50 |
6 |
22 |
1 |
LB |
0,45% |
|||||||||
|
LRU 24 |
2 |
2 |
1 |
LB |
0,80% |
|||||||||
|
LRU 19 |
3 |
3 |
1 |
LB |
0,11% |
|||||||||
|
LRU 26 |
2 |
2 |
1 |
LB |
0,01% |
|||||||||
|
LRU 49 |
5 |
9 |
1 |
LB |
0,09% |
|||||||||
|
LRU 29 |
3 |
3 |
1 |
LB |
0,07% |
|||||||||
|
LRU 20 |
11 |
32 |
4 |
LB |
10,84% |
|||||||||
|
LRU 41 |
5 |
7 |
1 |
LB |
0,04% |
|||||||||
|
LRU 52 |
6 |
14 |
1 |
LB |
1,19% |
|||||||||
|
LRU 33 |
8 |
19 |
1 |
LB |
1,05% |
|||||||||
|
LRU 54 |
2 |
3 |
1 |
LB |
0,28% |
|||||||||
|
LRU 51 |
6 |
9 |
1 |
LB |
2,77% |
|||||||||
|
LRU 18 |
9 |
47 |
1 |
LB |
0,06% |
|||||||||
|
LRU 3 |
14 |
23 |
39 |
LB |
4,17% |
|||||||||
|
LRU 6 |
8 |
17 |
3 |
LB |
9,09% |
|||||||||
|
LRU 8 |
4 |
13 |
1 |
LB |
4,05% |
|||||||||
|
LRU 40 |
14 |
31 |
1 |
LB |
0,59% |
|||||||||
|
LRU 4 |
2 |
6 |
27 |
LB |
1,59% |
|||||||||
|
LRU 7 |
2 |
2 |
5 |
LB |
0,81% |
|||||||||
|
LRU 23 |
8 |
25 |
1 |
LB |
0,04% |
|||||||||
|
LRU 5 |
3 |
6 |
3 |
LB |
0,15% |
|||||||||
|
LRU 35 |
2 |
2 |
1 |
LB |
0,07% |
|||||||||
|
LRU 30 |
4 |
4 |
1 |
LB |
1,54% |
|||||||||
|
LRU 53 |
10 |
30 |
1 |
LB |
4,69% |
|||||||||
|
LRU 37 |
13 |
26 |
16 |
RD |
147,14% |
|||||||||
|
LRU 38 |
10 |
21 |
29 |
RD |
165,79% |
|||||||||
|
LRU 36 |
1 |
6 |
1 |
LB |
0,02% |
|||||||||
|
LRU 31 |
4 |
11 |
1 |
LB |
0,96% |
|||||||||
|
LRU 32 |
6 |
25 |
1 |
LB |
5,71% |
|||||||||
|
LRU with members characterizes to you from FR=4. |
||||||||||||||
|
Nome LRU |
Critical types |
Population Critics |
Requirementses 10 |
Action |
CostoLB/CostoRD |
|||||||||
|
LRU 2 |
2 |
2 |
2 |
LB |
0,00% |
|||||||||
|
LRU 19 |
2 |
2 |
1 |
LB |
0,03% |
|||||||||
|
LRU 20 |
2 |
8 |
2 |
LB |
0,13% |
|||||||||
|
LRU 41 |
2 |
5 |
1 |
LB |
0,27% |
|||||||||
|
LRU 33 |
1 |
2 |
1 |
LB |
0,01% |
|||||||||
|
LRU 51 |
1 |
2 |
1 |
LB |
0,01% |
|||||||||
|
LRU 18 |
2 |
7 |
1 |
LB |
0,03% |
|||||||||
|
LRU 6 |
1 |
6 |
1 |
LB |
1,40% |
|||||||||
|
LRU 8 |
2 |
14 |
1 |
LB |
1,11% |
|||||||||
|
LRU 40 |
3 |
3 |
1 |
LB |
0,04% |
|||||||||
|
LRU 23 |
1 |
1 |
1 |
LB |
0,01% |
|||||||||
|
LRU 30 |
1 |
1 |
1 |
LB |
0,10% |
|||||||||
|
LRU 37 |
1 |
3 |
9 |
LB |
0,04% |
|||||||||
|
LRU 38 |
1 |
2 |
16 |
LB |
0,03% |
|||||||||
|
LRU 36 |
2 |
95 |
1 |
LB |
55,06% |
|||||||||
|
LRU 32 |
1 |
2 |
1 |
LB |
0,06% |
|||||||||
|
LRU with members characterizes to you from FR=3. |
||||||||||||||
|
Nome LRU |
Critical types |
Population Critics |
Requirementses 5 |
Action |
CostoLB/CostoRD |
|||||||||
|
LRU 3 |
1 |
1 |
11 |
LB |
0,10% |
|||||||||


| Top | Summary | < < Previous | Next > > /en/home.php" TARGET="_blank">>> Home Page << |